Infographic tools research
- charlotte2006lr
- Jan 19, 2024
- 3 min read
Updated: Jan 21, 2024
When creating infographic's we can use different software and websites to see which ones are capable of doing what we like and how easy it is to use. I will be looking at Piktochart, Infogram, Canva.
Piktochart

Piktochart is used to create interesting and well laid out posters and infographics. It's specific purpose is that it can be used by anyone and can be good if you have limited or no design experience. Piktochart says that they aim to help you make infographics within minutes. It works by finding a template and editing it. For example looking at this template, it has a big title showing what the theme/topic of the infographic will be about. In this one it's giving the audience study tips prior to exams. It uses a range of images linking to the theme e.g books and a student. It uses 2 different fonts throughout the infographic and sticks with them instead of changing them and making it messy. The colours are also kept the same or similar.
Using this template and changing the theming I can experiment using Piktochart.
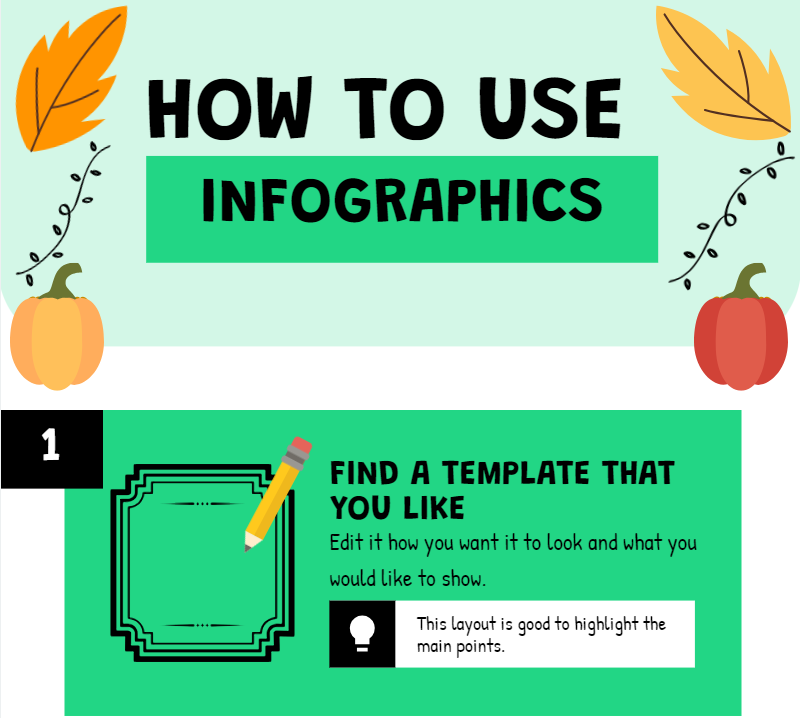
I changed the titles to be "How to use infographics" and removed the images that were associated with school. I kept the font that same as I liked how it looked and added different images. These came off of the actual piktogram website - showing how easy it is as if you did not have this you may need to find your own images and if they are not already a png they will need to have the background removed. Downloading is easy as it is signed at the top of the page instead of needing to search around for it like canva. Overall I think that piktogram has a large range of options which are all interesting and it is convenient and easy to use.
Canva
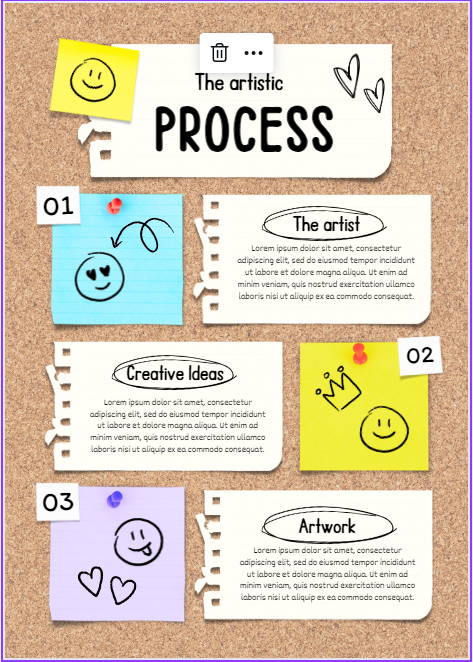
Canva can be used for a wider range of things such as instagram posts and youtube thumbnails. It is good for structuring content creation and making posts more interesting. Looking at this template it uses a range of different texts and nice images. This is to make it interesting and fun. I like this template as it gives a element of joy to the viewer and is is more fun and creative.
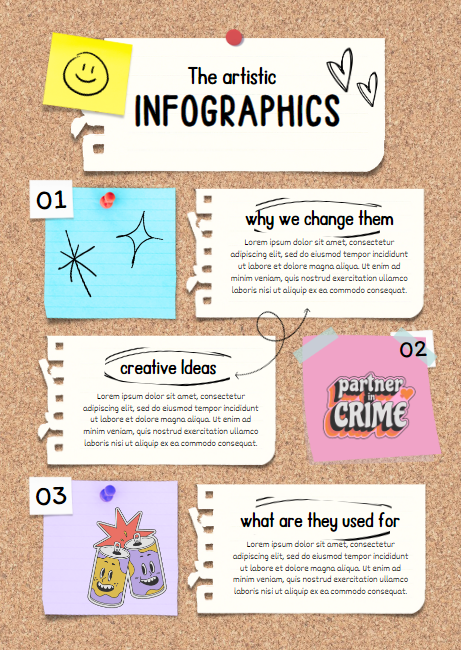
I have changed the infographic by changing the text and images. This was easy as there are different sections with different things in. For example, the swirly arrows and stars were in the section "Graphics" and the vintage style 70's images were the section "Lined Geometric friendship badges". I changed on of the post it notes as the yellow colour was too vibrant and did not work well with what I wanted to add to it. Downloading your infographic off of canva is easy however takes more steps to get there in comparison to infogram. I think that overall canva is a good tool to use to creating infographics however I would say there is a lack of structure and could result in the infographic becoming slightly messy.
Infogram
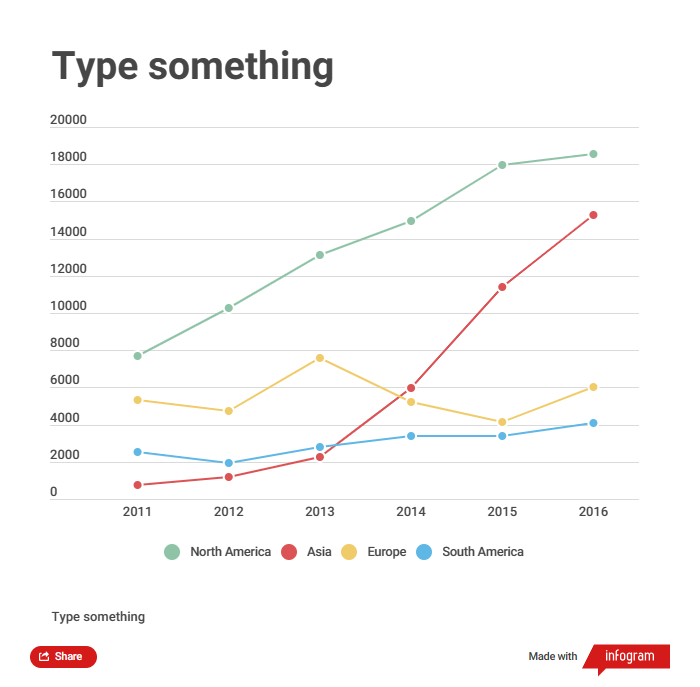
Infogram is better for plotting numetrical values in an infographic. For instance when plotting information on uni courses this could be good, such as location (miles away from home), grades needed to get in, tuition free, module amounts and how much I like the course. Looking at the infographic they have created a very basic line graph with data on. This features a range of different colours, dates and text which could be beneficial to use when creating my design.
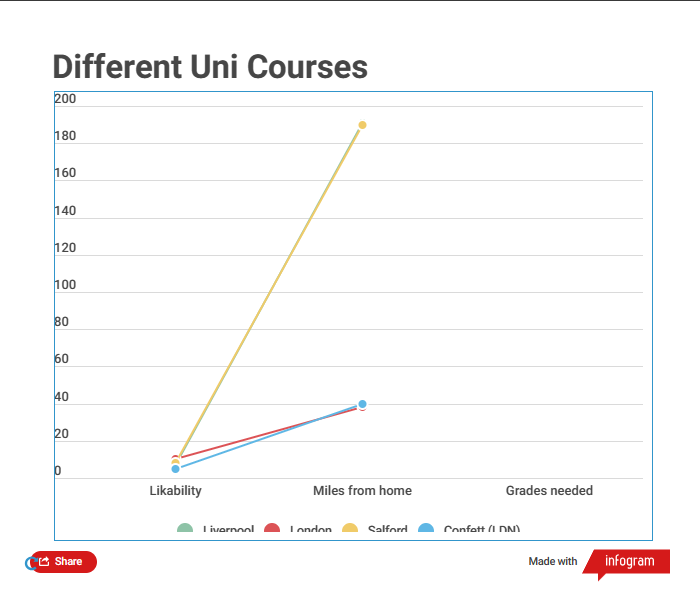
Using infogram I plotted some rough information just to compare how easy it was to use. I think that infogram was the trickiest out of the three websites as using a template and changing the information was more difficult and not as straight forward. However, even though it is not as easy as canva and piktochart, it is easier to download to your device. The download button is it the top right hand side and you can download it in many different formats.
Looking at all three websites and comparing them to what I will need to use them for i think that for plotting the infomation I am going to need to, infogram is the best. However, looking at the usability off all three piktogram makes the nicest to look at and the easiest to create. I like that on piktogram I can create my own templates as well as editing pre existing templates.
Comments